ECG Directory

Welcome to this interactive ECG course.

Although it is one of the oldest paraclinic exams, dating back to the late 19th century, the ECG is still of crucial clinical use. This examination often still poses problems of interpretation to the medical practitioner.

This course aims to help the student, the practicing physician and even the trained cardiologist to improve his knowledge in electrocardiography. It consists of 250 traces of varying complexity with a description of each one by experts. This allows the reader to compare his analysis with that of the experts. In addition, the areas of interest of the ECG can be activated to be clearly highlighted.

We hope that these plots will be useful to readers and will improve their knowledge.

The ECGs are available sorted by keywords and categories.
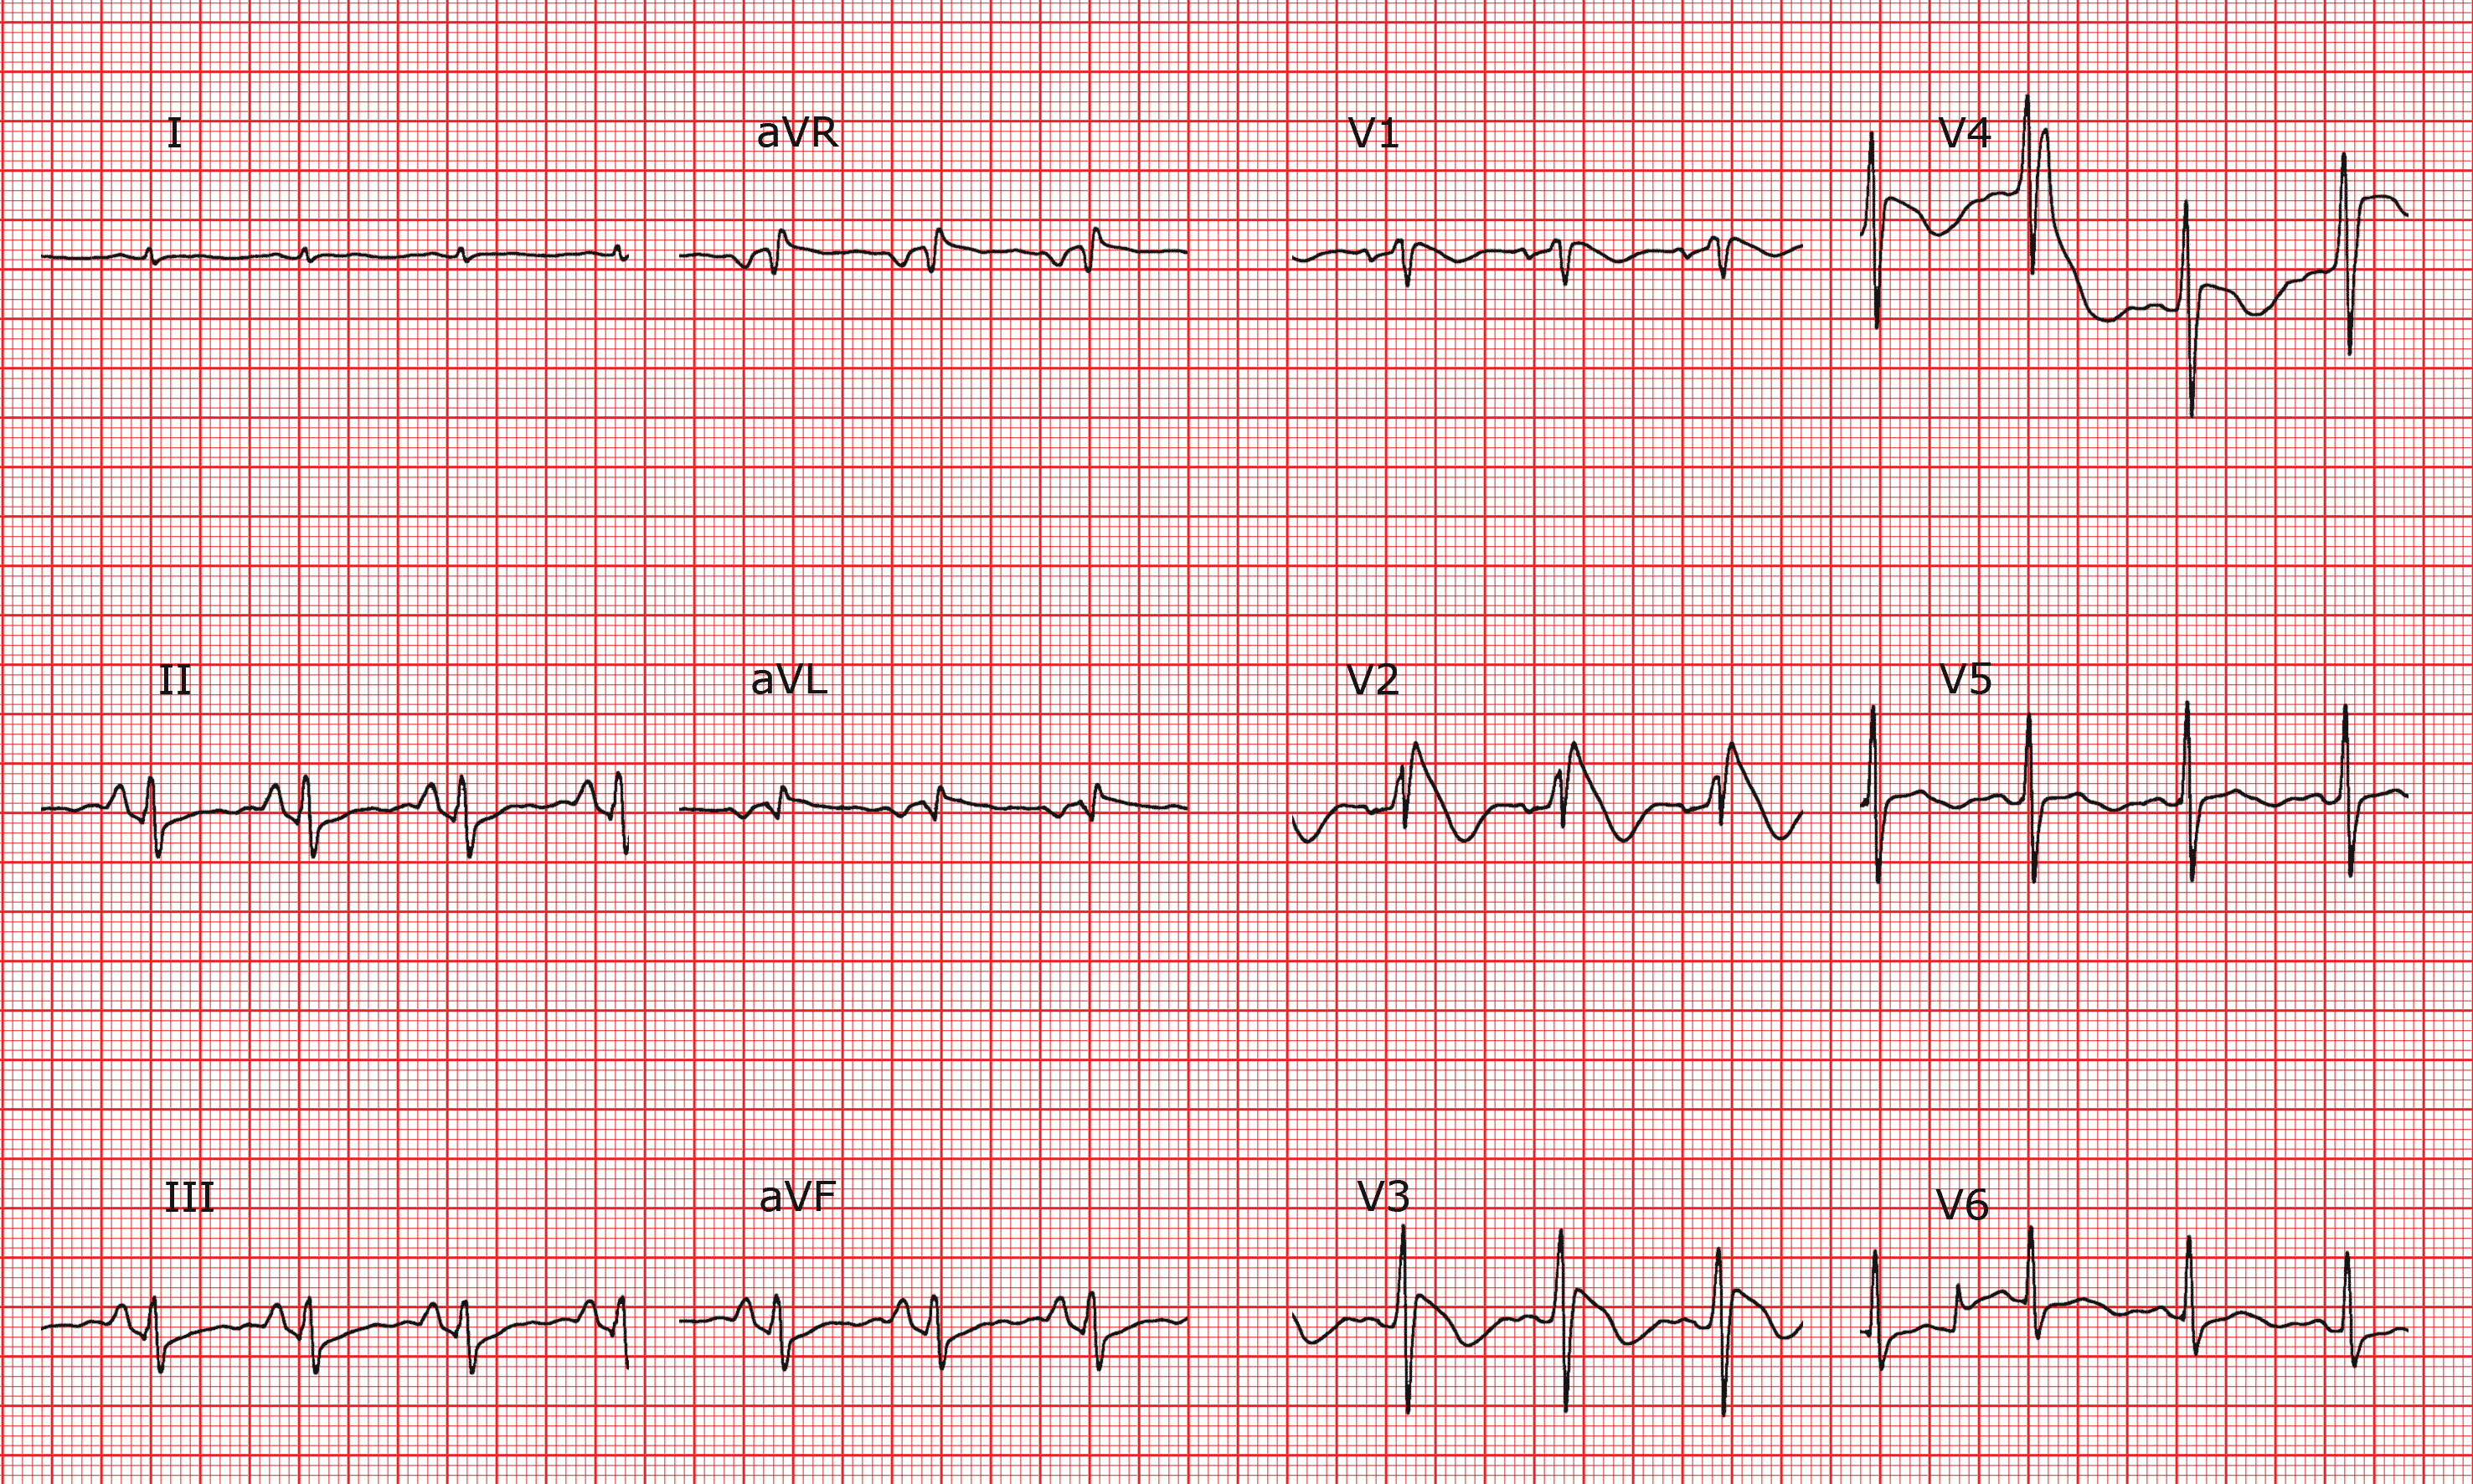
ECG 135

ECG 135

Description

Basic rhythm

Sinus rhythm at 100 bpm.

P waves

Normal.

P wave amplitude of 3 mV in leads II, III and aVF. PQ interval

Normal duration.

QRS

Atypical right bundle branch block shown. Deep S wave in II, III and aVF. Axis undetermined. ST segment: oblique descending elevation in V1, V2 and V3.

T waves

Negative in V4, V5 and V6.

QT interval

Normal.


Zones

ST segment elevation.
Increased P wave amplitude.

Diagnostic

Brugada syndrome. Right atrial hypertrophy with signs of strain from chronic lung disease.


Comments

The signs of right ventricular strain and atrial hypertrophy suggest pulmonary hypertension (in this case linked to COPD). The right bundle branch block showing in V1 is atypical and relates to Brugada syndrome (which must not be missed due to the risk of sudden death involved). If all the waves are small in lead I then this is usually caused by COPD.


Category

Various cardiopathy


Keywords


Reading level

1 / 3